Add a fourth colour and the
transition changes character
If each square can hold not just two states but three, four, five or six, does the melting still happen the same way — or does it change into a different kind of event entirely?
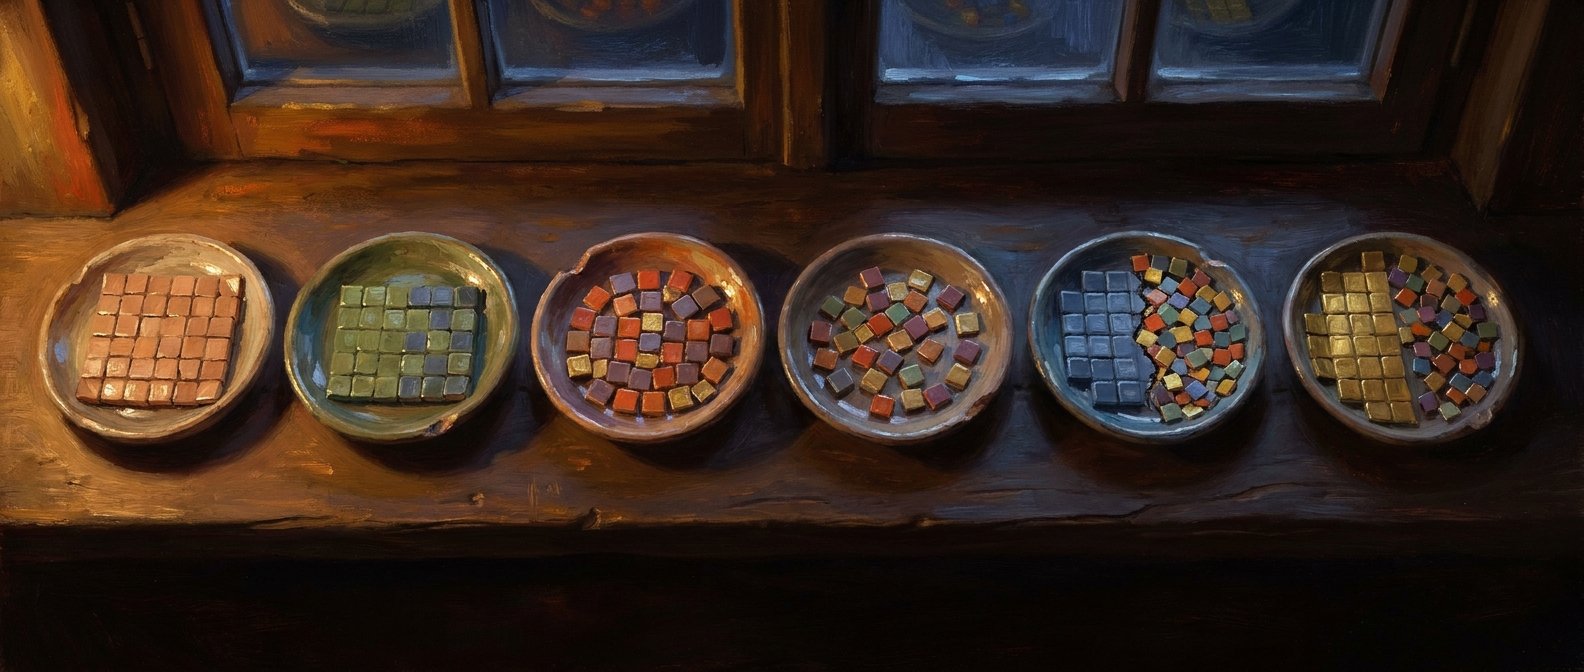
The Ising magnet gives every site two choices: up or down. The Potts model generalises that to q choices — call them colours. Neighbouring squares are happier when they share a colour, and heating the system makes them stop caring. With q = 2 you get the Ising magnet back exactly.
Turn q up and something changes that has nothing to do with the temperature moving. At q = 3 and q = 4 the transition is continuous: the order fades out smoothly, and if you zoom in on the moment of melting you find structure at every scale. At q = 5 and beyond it becomes first-order — a discontinuous jump, the same category of event as ice becoming water. The ordered and disordered states stop blending and start coexisting, in patches, at the same temperature.
The signature is in how the fluctuations behave. In a continuous transition the susceptibility rises to a rounded hill. In a first-order one it spikes: taller, narrower, more violent. Across q = 3, 4, 5, 6 the measured peak climbs from 134 to 370 to 824 to 1063 — you can watch the character of the transition change in the shape of a curve.
There is a practical trap here worth naming, because the lab fell into it. Nudging one square at a time gets stuck going through a first-order transition — the system sits in a metastable state and reports noisy, multi-peaked nonsense. A first attempt did exactly that. The fix is to stop nudging single squares and start recolouring whole connected blobs at once. The panel below uses the blob method, and you can watch the blobs.
left · the q-coloured lattice. The pale
outline is one Wolff cluster, caught in the beat before it is repainted a
different colour — that is the whole update rule, visible · right · the
susceptibility ladder for each q you have visited, on a logarithmic axis
because the peaks differ by more than a factor of ten. Dashed lines are the exact
T_c = 1/ln(1+√q). Pick q = 6 and sit at the dashed line: the lattice
flickers between one dominant colour and confetti, both at the same temperature.
That bistability is a first-order transition seen from the inside.
Read the demo's own peaks honestly: the ladder is walked hot → cold, and at q = 5 and q = 6 the lattice stays disordered well past its exact Tc before snapping over, so the demo peak lands below the dashed line. That is supercooling — a system sitting in the wrong phase because the right one has not nucleated yet — and it is the defining behaviour of a first-order transition rather than a bug in the panel. The published run misses in the same direction for the same reason, by less, because its ladder is far longer.
Those are the promoted run — 2026-06-25, L = 64, Wolff cluster updates, 25 temperatures per q inside Tc ± 0.12, 471 seconds on GPU. It measured 1.002 against the exact 0.995 at q = 3, 0.907 against 0.910 at q = 4, 0.822 against 0.852 at q = 5, and 0.749 against 0.808 at q = 6.
An independent repeat on 2026-08-13 — same lattice, 545 seconds on CPU — landed slightly further out on the first-order half: 1.001, 0.901, 0.801, 0.739, with the q = 6 miss at 8.45 %, the largest relative error anywhere in the M series. Its peak-χ ladder read 107.3 → 420.3 → 811.2 → 1040.9. The two runs agree completely on the thing the milestone actually claims — where the transition changes character — and disagree at the third digit on the first-order temperatures, which is exactly what a first-order transition on a finite lattice is expected to do.